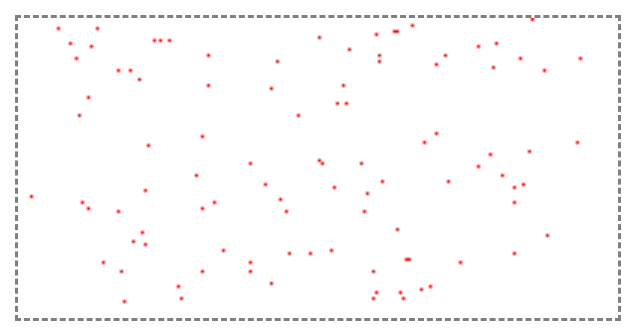
使用 canvas 在页面上绘制100个随机生成的点
<!DOCTYPE html>
<html>
<head>
    <meta charset="UTF-8">
    <title>随机画点</title>
    <style>
        canvas{
            border: 1px dashed gray;
        }
    </style>
</head>
<body>
        <canvas id="cvs" width="200" height="100"></canvas>


  <script>

    //画布
                var cvs = document.getElementById('cvs');
                //画笔
    var ctx = cvs.getContext('2d');


                //设置画笔颜色
                ctx.fillStyle = "red";

    //初始化数组,用它来存储各点的坐标
    var points=[];


    //调用函数,随机生成100个点,并把它们的坐标放入数组
    createPoints(100);

    /*
        遍历数组,把所有的点画出来

        forEach()函数的参数,是一个回调函数
        参数p 表示 数组points里的一个元素,准确说是遍历到的当前元素

        fillRect(x,y,width,height)函数:
        填充坐标(矩形左上角)为(x,y),长宽为(width,height)的矩形
    */
                points.forEach(function(p){
                    ctx.fillRect(p[0], 100-p[1], 1, 1);
                });


    /*
      在(0,0)-(200,100)矩形范围内,生成随机的n个点
      把这些点的坐标,放入数组
    */
    function createPoints(n){
      for(var i=0;i<n;i++){
        //x坐标,y坐标
        var zbx = parseInt(Math.random()*201);
        var zby = parseInt(Math.random()*101);

        //在控制台打印“点的坐标”
        console.log("("+zbx+","+zby+")");

        //一个点
        var point =[];
        point[0]=zbx;
        point[1]=zby;

        //把数据放入数组
        points.push(point);
      }
    }

        </script>
    </body>
</html>
|